It is essential to understand what is slow before starting to optimize. And understanding the slow pieces in code requires profiling the code to figure out the hot spots and making efforts appropriately to optimize slowness inside the hotspots.
I have been writing code and designing systems for two decades now. Even with this experience, when profiling via systematic tools, I see hotspots that I had not initially expected. Thus just using the gut or briefly exploring the logs isn’t sufficient to decide what to optimize.
Below I am pointing out some tools that I have used in profiling java services:
Here are some general tips on how you should profile:
- Profile on a host with similar hardware to the production host. Don’t profile using your laptop or workstation, even though that may be more convenient.
- Warm the service before profiling. Profiling from a cold start will give you inaccurate data.
- Profile using production data so that the profiler reflects coverage, CPU time, and memory usage based on the production load.
- I prefer profiling via sampling to understand the hot spots and only run profiling via instrumentation on specific routines to dig in deeper. Instrumentation adds significant overhead on execution and can skew the numbers if looking from a bird’s eye’s view.
CPU profiling
See below the execution call tree under-sampling. This diagram indicates that the hot spots are in NettingExecutor and ClassificationEvaluator. Later we spent more time instrumenting the code and figuring patterns in the processed data. In this case, we realized below optimizations were needed:
- Modify the algorithm to reduce the number of redundant steps
- Memorize previously calculated values and write them into a temporary cache to avoid redundant calculations.
- We modified the data structure and algorithm in use here. Some of our routines were using a treeset that would internally sort the data. We changed it to a list on which we wrote some code to prune the data, we didn’t need all the data, and then we sorted the list via timsort.

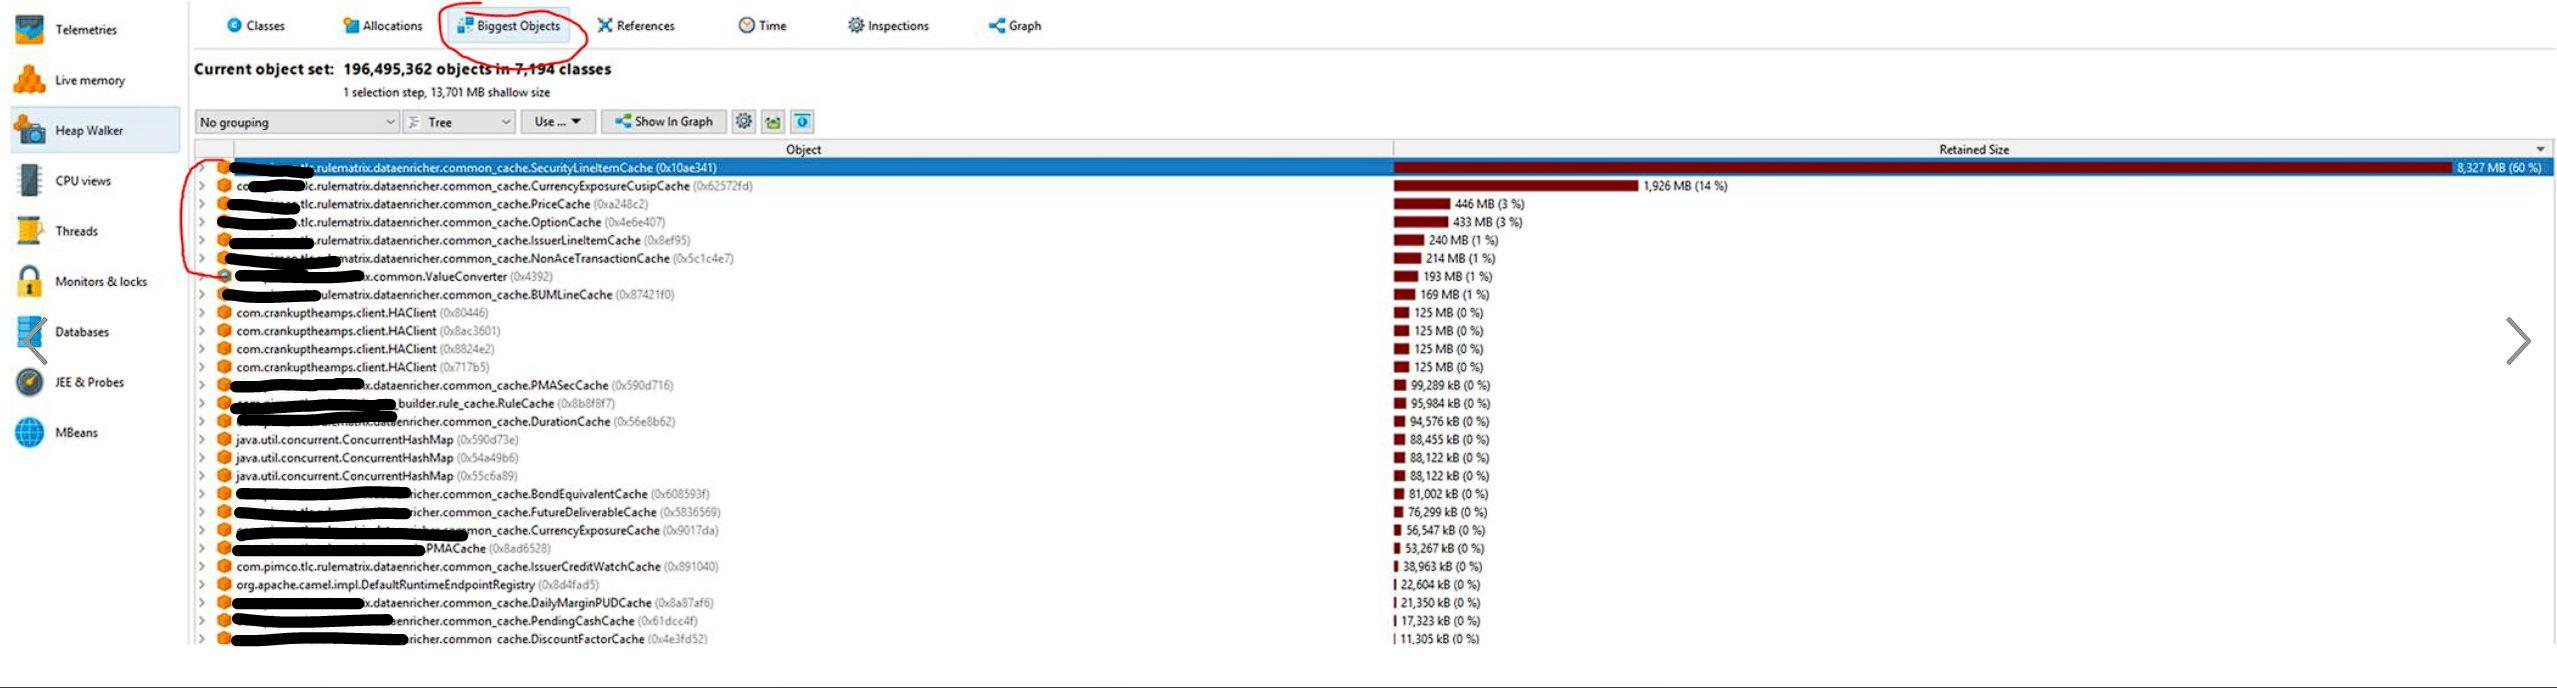
Bring cache size from 12GB to 4GB
Our application was using a lot of memory. We needed to understand where the memory is going and realized that a few in-memory caches were the biggest culprits per the below diagram. We later modified the objects holding the data to reduce memory usage and shared the references between objects using an object pool. With these changes, we could bring the startup memory of the application down to less than 4GB from over 12GB.
Understanding allocation rates of objects per execution
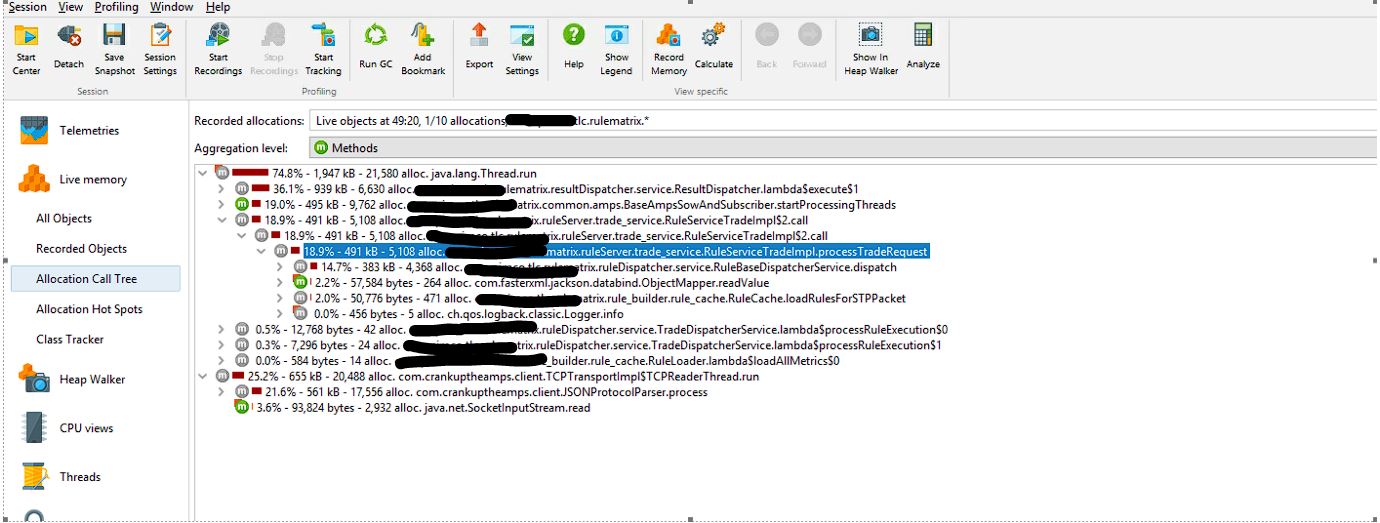
Our application was designed as a stateless service that worked on large data sets where it initialized the data internally, worked on it, and then released the memory. These actions were resulting in frequent GC spikes and pauses. We looked at the allocation call tree to understand areas that executed the most frequent allocations.
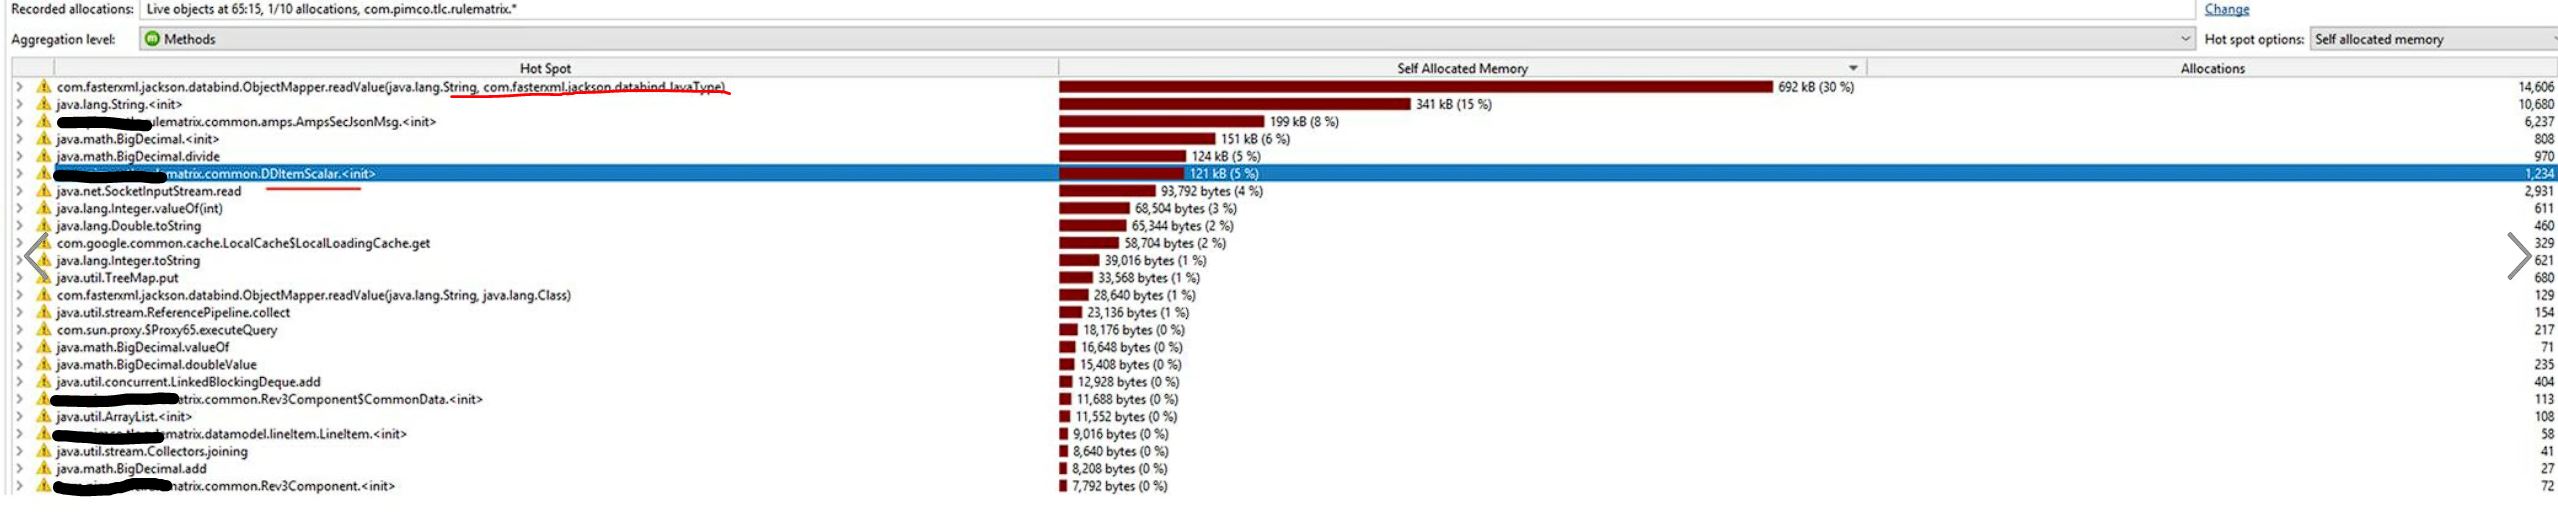
Here is another way to look at the allocations to check the objects allocated between two different execution times. As per the below diagram that shows the number of allocations between two times, we realized that we frequently pulled into the process memory a large object over pub-sub. Per below, parsing and transforming that object to POJO took many allocations.
JVisual VM
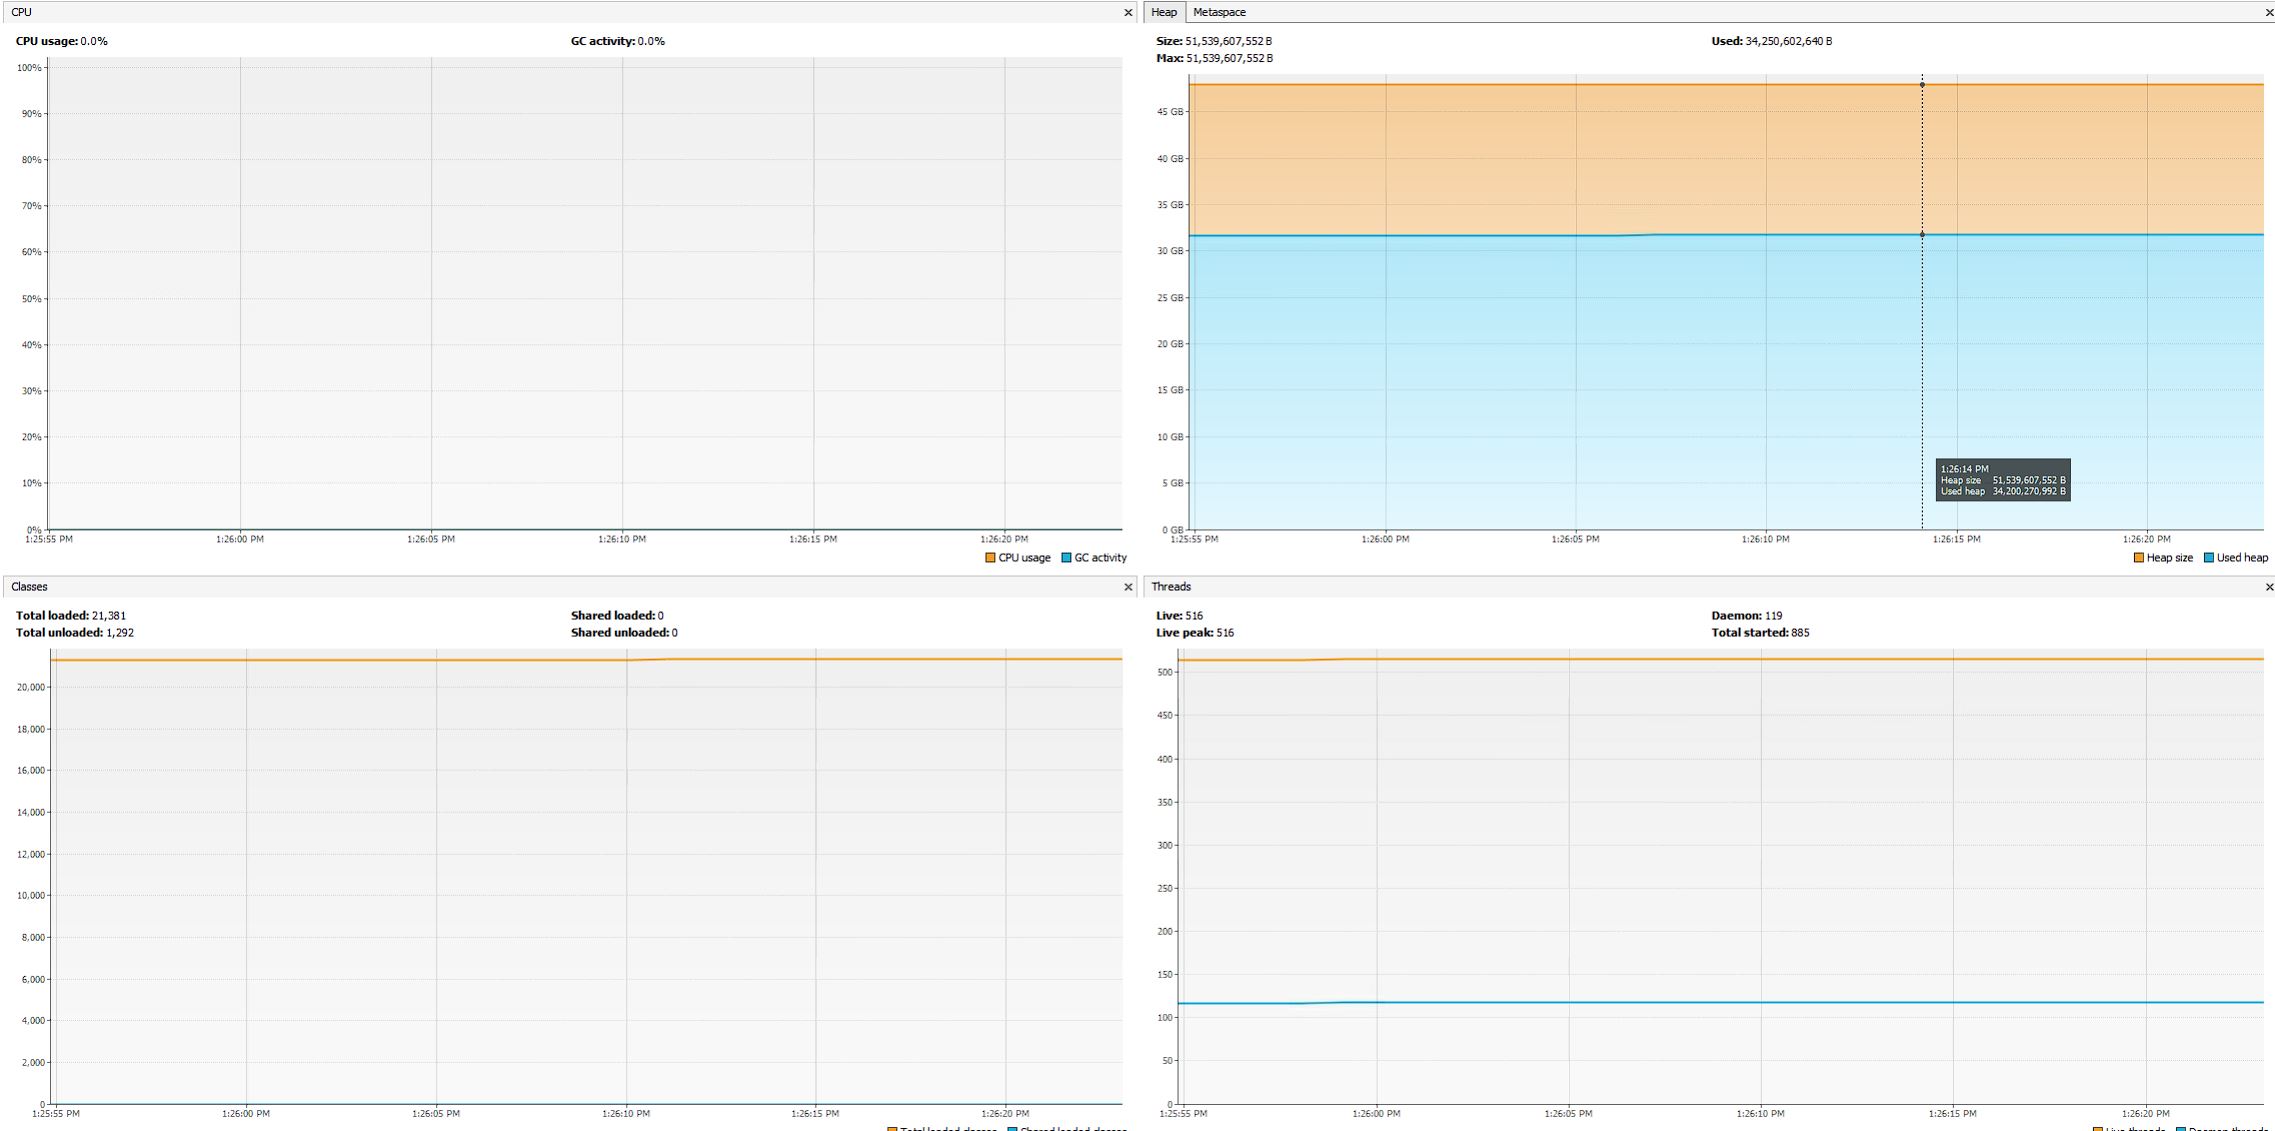
Here is another excellent and simple tool that shows a high-level overview of memory, threads, and CPU.
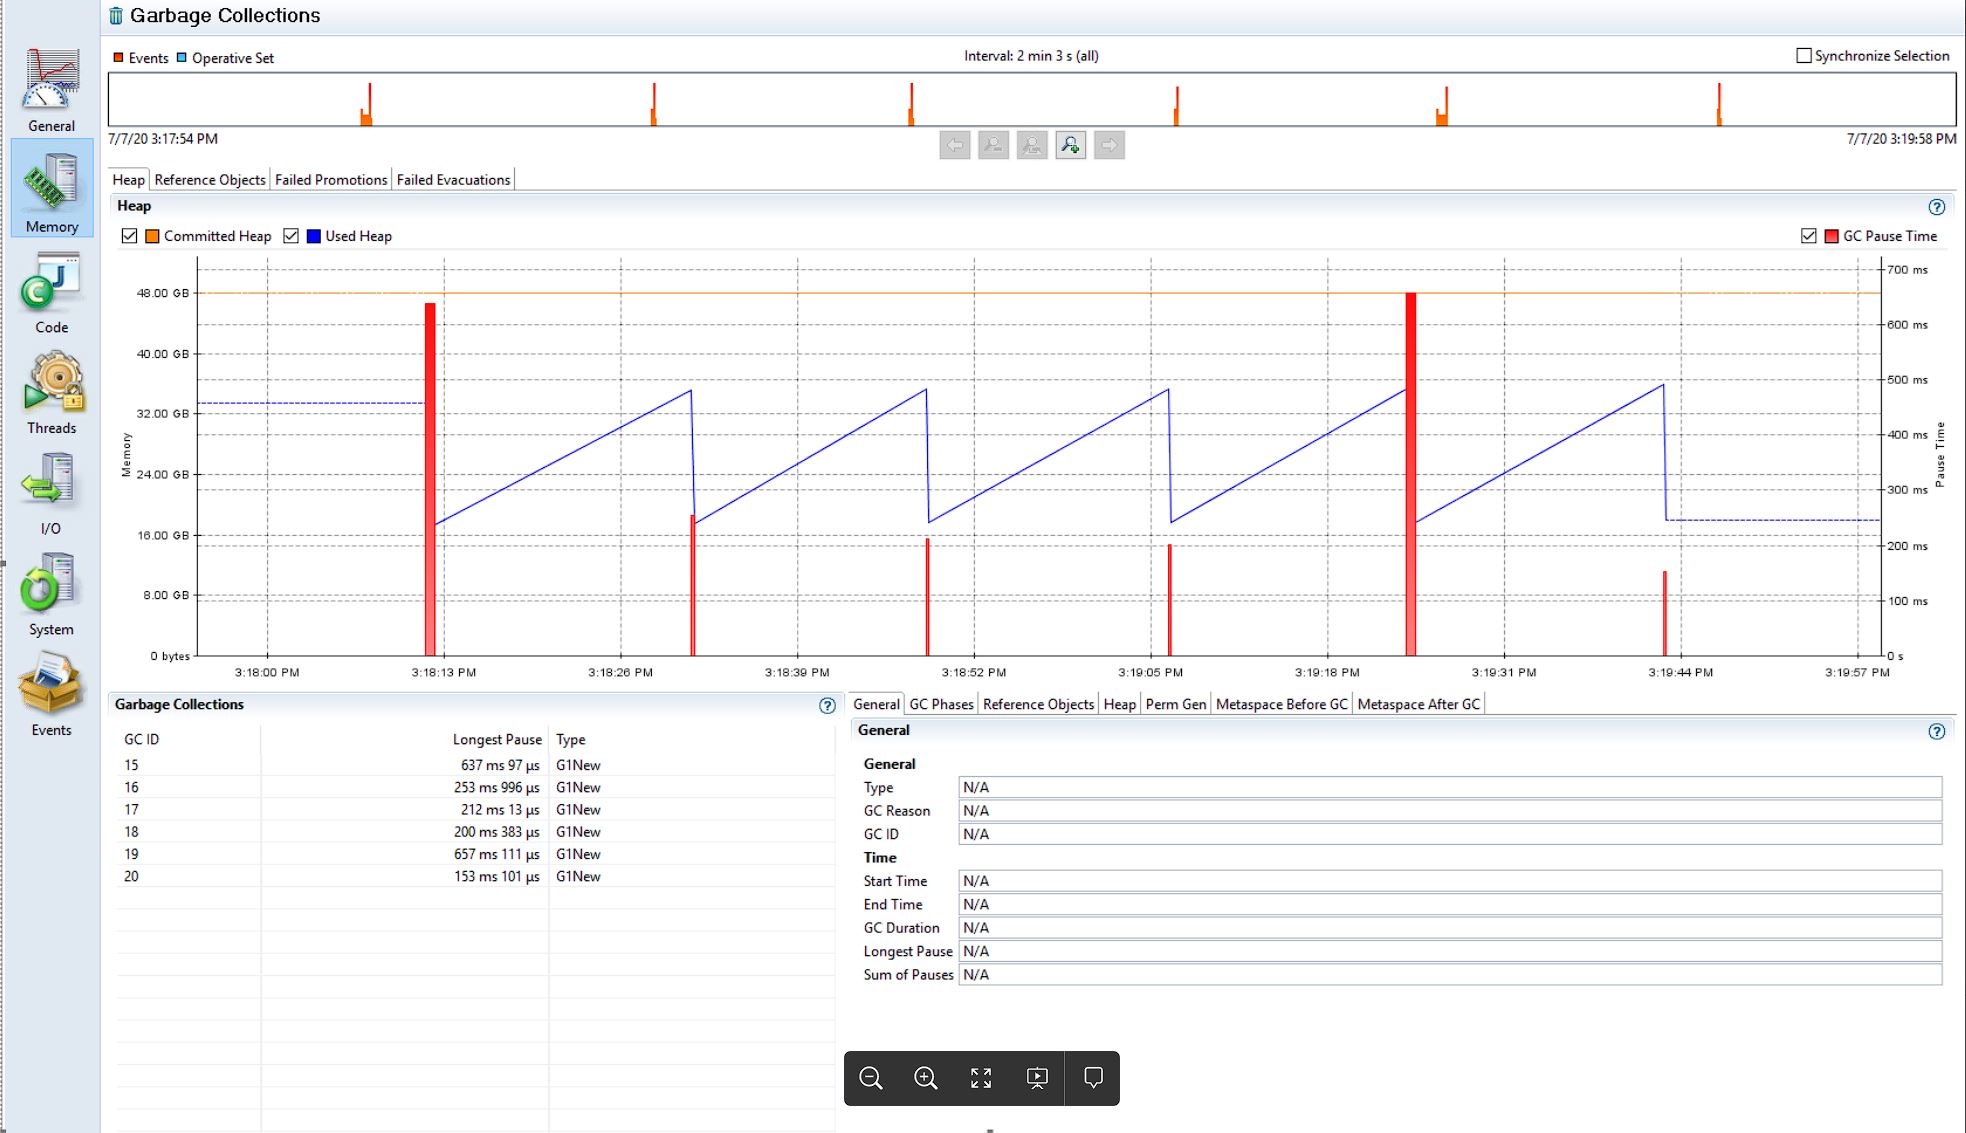
Flight recorder
Flight recorder is an excellent tool available via oracle JDK. The below image shows GC activity between two different times and, in addition, the length of GC pauses. This information offers a bird’s eye overview of JVM memory and GC activity.
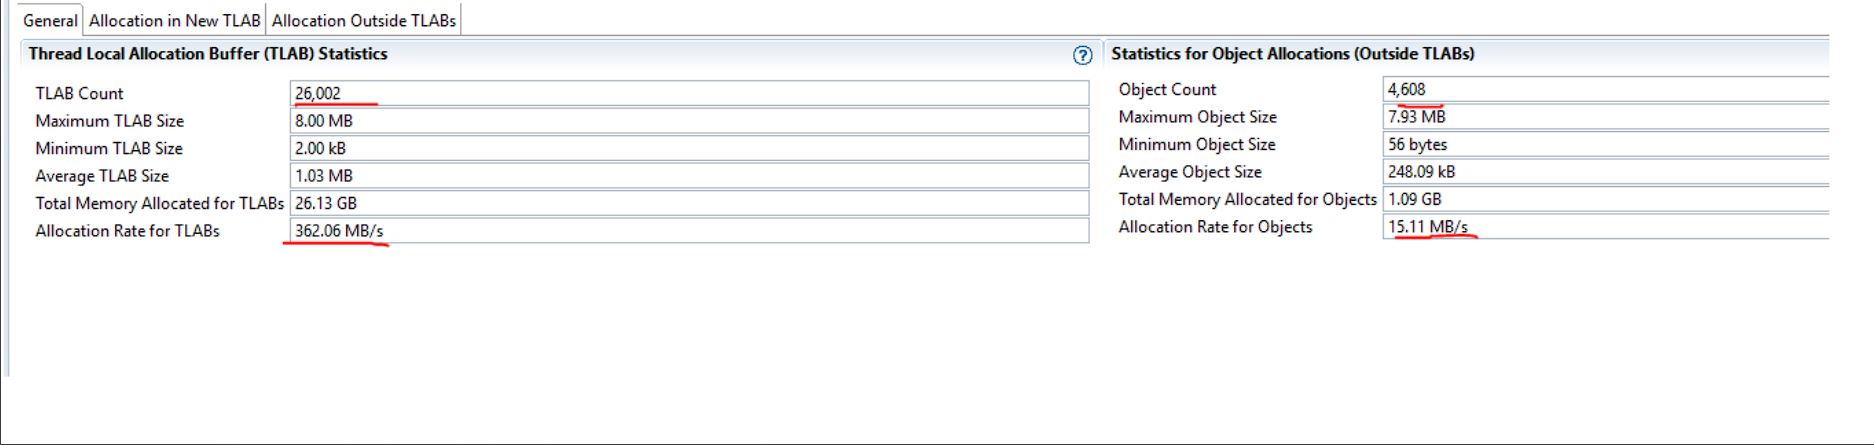
Understanding TLAB activity
The below diagram shows several objects inside and outside TLAB while connecting to JVM under load. Per below, we see a significant number of objects allocated outside TLAB. Note the slowness in allocations when objects are allocated outside of TLAB.
See below where I analyzed allocation calls resulting in allocations outside TLAB. This occurs while saving a large binary object to a blob in DB and making a call to a service where large JSON objects are being transmitted over wire. In the case of the binary object being allocated and persisted to DB, we modified its design to run asynch, so slowness in its allocation and persistence to DB doesn’t slow down the processing. In addition, the developers should look into trimming down the size of the object transmitted to an external service over JSON.

Analyzing JVM GC logs
GC logs over a long period are massive. Mentally creating a timeline of GC activity over a long period is not easy. GC viewer helps visualize GC activity over a period that is useful to understand how the application performed under a load test. GC viewer is an open-source tool and available at: https://github.com/chewiebug/GCViewer
See below an image of GC viewer here.
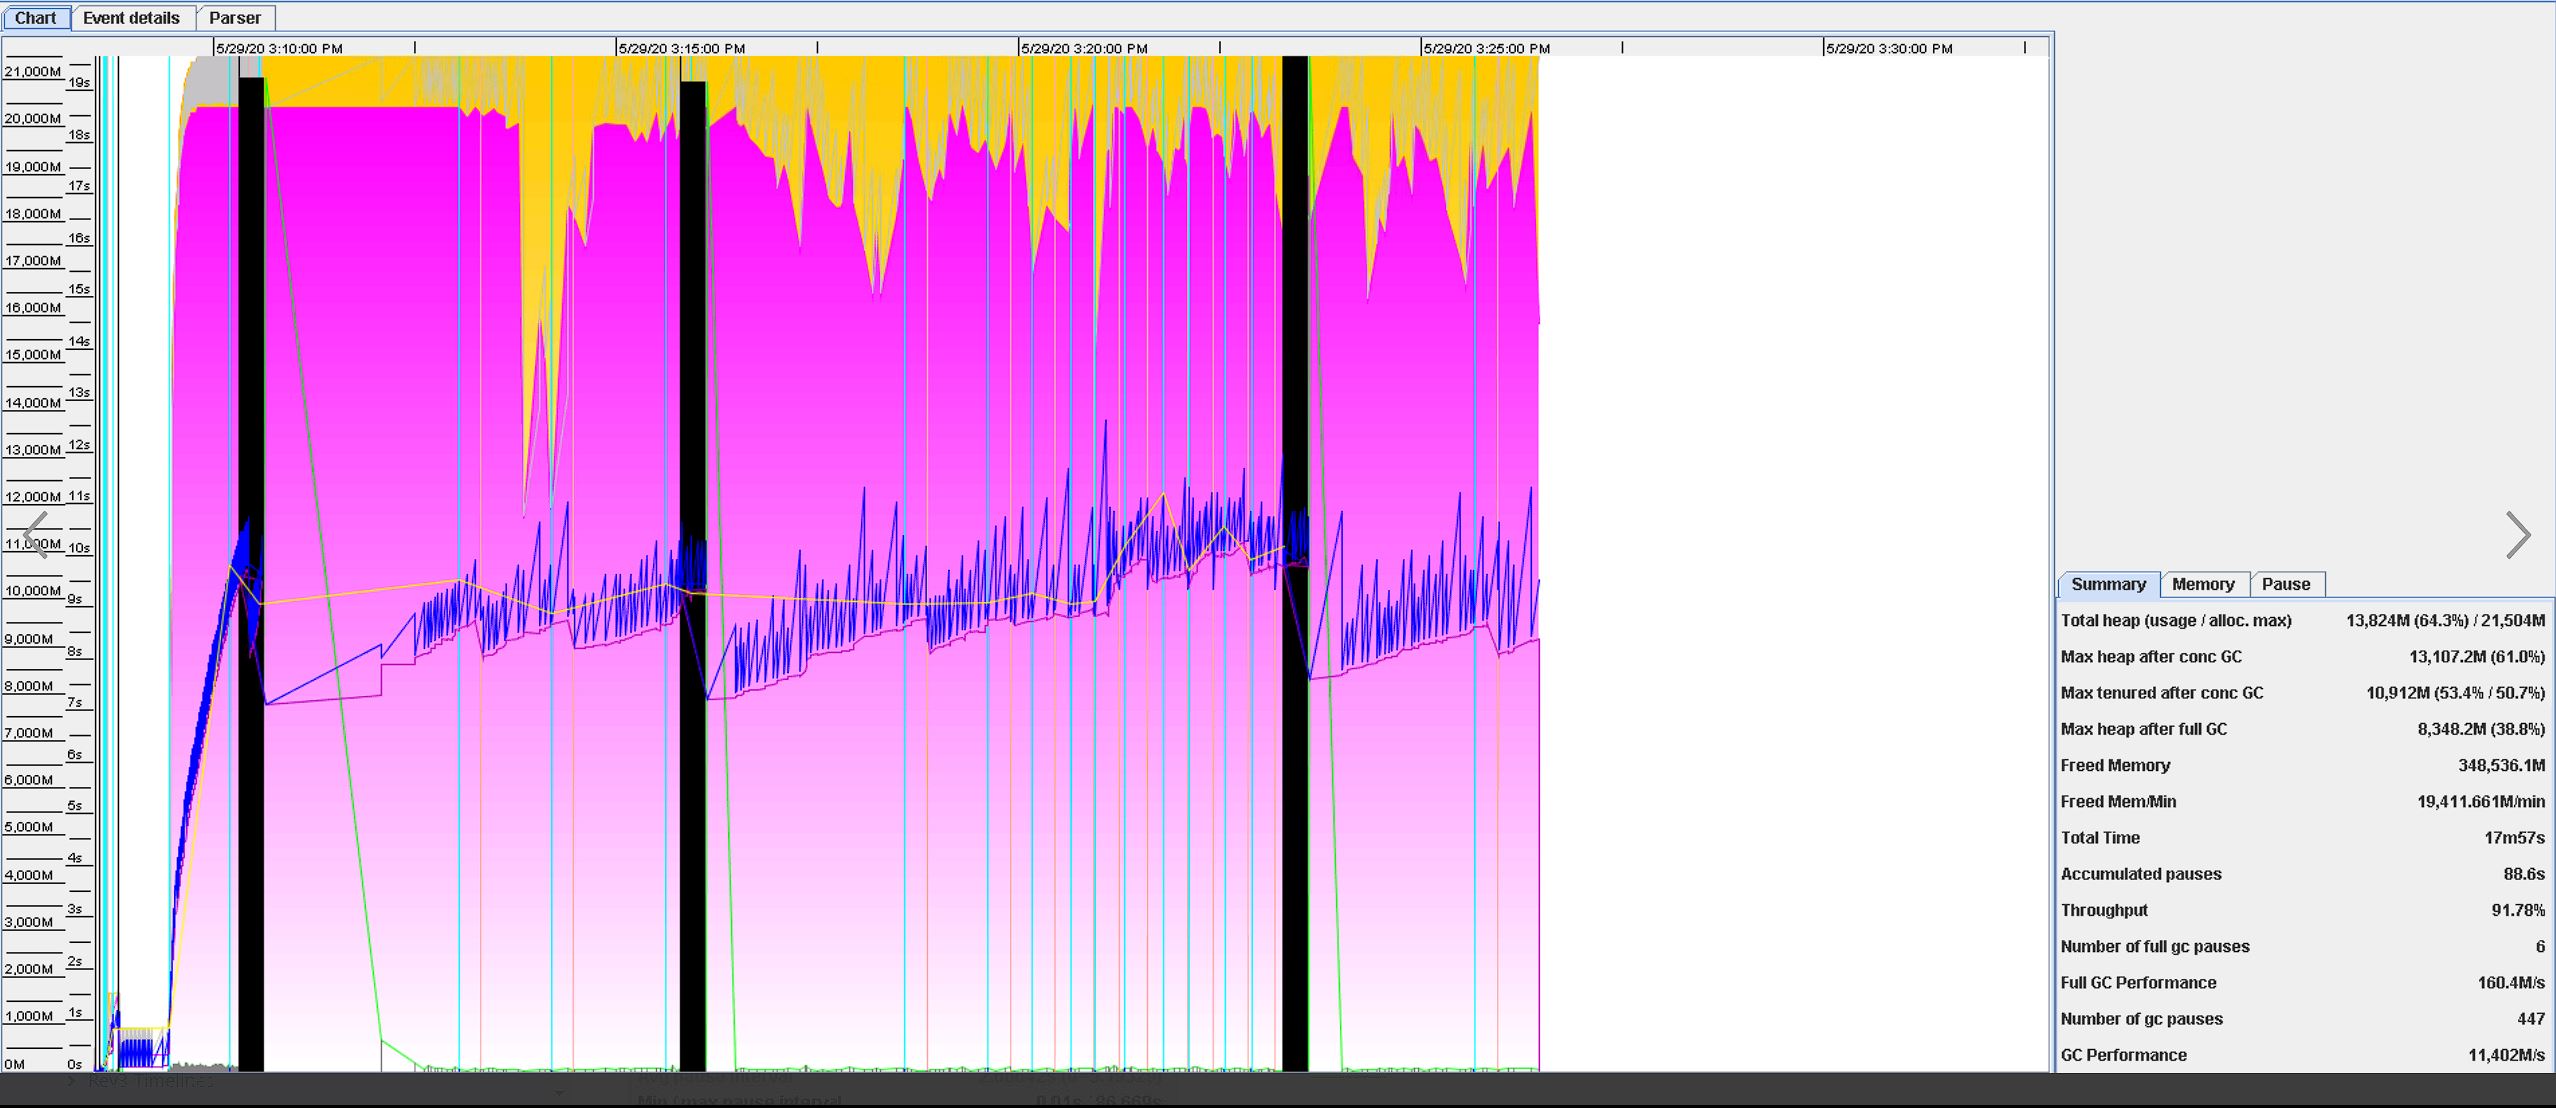
Here is a summary of GC activity that GC viewer displayed.

Here is an excellent article from uber that describes their performance tuning exercise to improve efficiency in their data streaming pipelines: