Here I will attempt to describe the system design for Uber – a ride servicing firm. While this design at a high level is fairly simple, its always that the “devil is in the details”. It is a fairly complicated design once you start digging into the details. My idea for this design is borrowed from the various high-quality blogs and videos provided by Uber Engineering. Please go over links to various references that I have included here – these references are from Uber’s engineering blogs and contain illuminating information. I wrote this article in October 2021 via utilizing Uber’s blogs and videos, some of which are current while others date back to 2016.
Per recent Uber’s engineering blogs, Uber has moved or is in process of moving from Cassandra to using their in house built schema-less DB and Google Spanner. Per Uber blogs the intent of this move was that Cassandra’s light weight transactions don’t perform well at Uber’s scale. As a note, Cassandra is currently improving efficiency of their Paxos implementation for light weight transactions and also introducing general purpose transactions in the next version of Cassandra.
Content
- Functional Requirements
- Non-Functional Requirements
- Storage and Capacity Estimation
- High Level Design
- A very brief intro to Google S2 library
- Uber Market Place – connecting riders with drivers
- Mapping drivers location accurately and efficiently
- Processing read requests by riders efficiently
- Calculate ETAs accurately
- Data storage design
- Sharding and dynamically handling high load in regions
- Design choices for high availability
- Interesting items not covered in this design
- References
Functional Requirements
The below functional requirements are covered in this design:
- Match supply (drivers) with demand (riders)
- While designing, we should cater to extensibility to new products such as freight & uber eats
- The rider should be able to request a driver to drive them to a destination
- The rider should be able to confirm the driver choice and vice versa
- The rider should be able to see the charge for the ride before committing
- The rider should be able to see ETA for the driver as well ETA for the ride
- Drivers can add or remove themselves from the system at any time
- Drivers should be able to navigate to areas of high demand at anticipated times in pursuit of higher fees
- Users should be able to see their historical trips and charges
- Drivers should get paid after completion of their trips
Nonfunctional Requirements
- The system should support high availability
- Design should be highly scalable
- Latency for requests should be fast
- The system should give an accurate location of the driver and pickup/drop off spots
Storage and Capacity Estimation
Assume that total number of drivers we are supporting is 4M. We can estimate that at peak we have 25% of drivers active. As we will find below, client sends driver updates to the backend in a batch (assume 5 seconds). So we will need to support 1 million divided by 5, which is 200K driver location updates per second. As we will see below, we can divide the regions into clusters with configurable pods dedicated to sub regions within the cluster.
Assuming a driver location update consists of driver id, vehicle id, latitude, longitude and 8 bytes of additional space, it will consist of 40 bytes. Assuming we are storing 1 million updates every second, we will need 40MB of storage per second. Daily storage is thus 1TB. For back end analytics, we don’t need per second driver updates and can likely store every ten seconds of data. That would amount to 100GB of storage. Thus our yearly storage requirements for driver’s location is 10^11*365 = 36TB.
We can store driver’s last 10 minutes of data in distributed memory, this would amount to less than 100GB of data.
Assuming that a single commodity machine can run 200 threads, with each thread taking 20ms of time, a single machine can manage 10K updates per second. Thus we will need 25 machines to manage 250K updates, running at full capacity. If we estimate to have the machines run at 30% capacity, we will need 75 machines to manage the driver update location update load.
Lets assume that at any given time number of riders looking for rides is 10% of the available drivers (this is likely since most of the riders would in-fact be getting served by drivers). This would amount to 25K match requests per 30 seconds. Its reasonable to estimate the matching time as large since humans have to interact with the system to accept rides. Lets assume that the time for the backend to find possible match and manage a consistent state in the database for a match is 2 seconds. Assuming a single commodity machine has 12 cores and 8 threads per core, we can run 200 threads on a commodity machine. Thus a single machine can process 100 match requests per second. Number of match requests per second that we need to process is 25K/30 ~= 1K. Thus we will need 10 servers at full capacity to manage the load, assuming servers are running at 30% capacity, we will need at least 30 servers.
There is additional infrastructure needed to estimate pricing and demand in near real time. In addition, we need to provide a more interactive experience to the riders that are waiting to be matched for which we will need additional processing.
Additionally there is infrastructure for payments, authentication, rate limiting, physical databases, distributed memory and more which I haven’t estimated here.
High Level Design
The system needs to connect demand (riders) with supply (drivers) at a high level. However, the system has no control over when drivers and riders will use the system. Thus, we need to serve drivers and riders by adding them dynamically into the system. In addition, the requirements pose a challenge where we need to divide regions (cities) based on anticipated demand. For areas with high demand, we can subdivide them into multiple small spaces to avoid hotspots, and for sparsely populated regions, we can combine larger areas into a single block.
Since our users will dynamically join the system, we need to structure our data structures to support fast adds and removes. We will also need to provide high availability, so our service doesn’t get disrupted – I will cover this in detail in the high availability section below. Finally, the load on our system will vary through day and around special events such as on new year’s eve in a busy down (think New York). Thus we will need to design our system to support varying supply and demand. Again, I will go over this in more depth in the section on sharding and handling high system load.
If we could split the earth into small regions based on latitude and longitude and process load in areas independently, then it would be the start of a good design. We can utilize a consistent hash ring and google s2 library for this. I will cover more on the google s2 library below. But in short, it divides the earth into configurable (large or small) chunks and can map a location (latitude and longitude) to a chunk id. If we map the region IDs of the google s2 library to a hash ring, we will be able to split the work nicely based on regions while adding and removing compute capacity for an area based on demand.
We will need a way to determine the price of the ride; this can be dynamically calculated based on a base price that changes based on anticipated demand and supply at the time of the ride.
We will need to store trip history and pricing in a consistent store – RDBMS database. In addition, we will need to store transient location data (driver’s and rider’s) location data in a data store that supports fast writes and reads – I will cover more on storage separately below.

In the above design diagram, we use a series of nodes set up in a consistent hash ring per product. Then, based on the type of product, we map users to the appropriate hash ring. For example, Uber had originally sharded their data based only on geo-zones. However, as their product offerings increased, they realized that in addition to sharding by geo-zones, they need to shard before by-product.
By sharding per product, we can handle various products independently and cleanly in our system – imagine the design of the freight-based product will be very different from that of a ride pool. Via the G2 library, we map coordinates to an id that maps to a node in the consistent hash ring. Thus marketplace nodes in the ring can connect users (drivers and riders).
A very brief intro to Google S2

See the image above where based on a location and a radius, the data in the region such as drivers, their state, and location can be quickly returned. G2 can do this efficiently by dividing the regions on earth into segments where the size of areas can be configured and can map each region to a numerical id. Thus based on an id, we can shard the areas. In addition, the numerical id into which a region maps is interesting in that the neighboring regions are mapped to numerical ids close to the given region id.
Please look at the links below in references to find a more detailed presentation on the Google S2 library. In addition, you can explore s2map.com to visually see how the library divides latitude/longitudes into regions. Additionally, see more on s2 here: https://s2geometry.io/.
Market Place – Connecting Riders with Drivers

When a user (rider) looks for a ride in a given area, they query the uber backend for drivers based on their location and search criteria. The backend needs to detect available drivers in the user’s proximity and send them requests for the trip. The first driver to accept the proposal gets the rider assigned, but the rider has to accept the driver and logistics (trip cost, route, eta) before committing to the ride. Therefore, the backend must handle this in the form of a 2 phase commit. One part is the driver accepting and then the rider confirming the driver and logistics before the trip commits.
For this process to work effectively, the system must track real-time locations of available drivers and those currently serving riders. In addition, the system must pair drivers with riders based on the overall health of the marketplace. For example, a driver who is currently driving a user to a destination close to the rider may be best suited for taking this ride rather than another driver who is available but further away. Hence, when searching for K nearest drivers, we must consider additional factors besides proximity when finding the K most applicable drivers. See more on Nearest neighbor search here.
Lastly, the geo signals are not very accurate. Hence, we should identify pickup zones where a rider should travel for pickup. The zone could be street intersections in downtown or some specific intersections for a large university campus. Intelligence can be built into the system to identify pickup centers based on the frequency of requests in an area.
Mapping drivers location accurately and efficiently
As the drivers are constantly driving, their location data will change very quickly. Therefore, we will need to store this real-time data correctly and efficiently. For example, see below in references an article from Uber that describes how they map inaccurate GPS data to roads while estimating the driver’s direction and location accurately.
In short, we will need to process the location updates in batches. For example, the client can aggregate the last N seconds of GPS data and send that to the backend in one call. The backend will need to map the driver to a data processing service quickly; this can be done via utilizing location-based indexing via the S2 library and then writing into a datastore that supports fast writes, such as Cassandra.
Processing reads requests by riders effeciently
Riders generally need to issue read requests where the search entails going from an origin to a destination. This requires reading location-based data for drivers efficiently. Cassandra is great for fast writes but not so very fast for reads. For the read requests, we only need recent driver data. Thus, we can store the driver location data in a distributed memory store with a TTL. Uber uses Redis for this purpose efficiently.
Calculating ETAs accurately
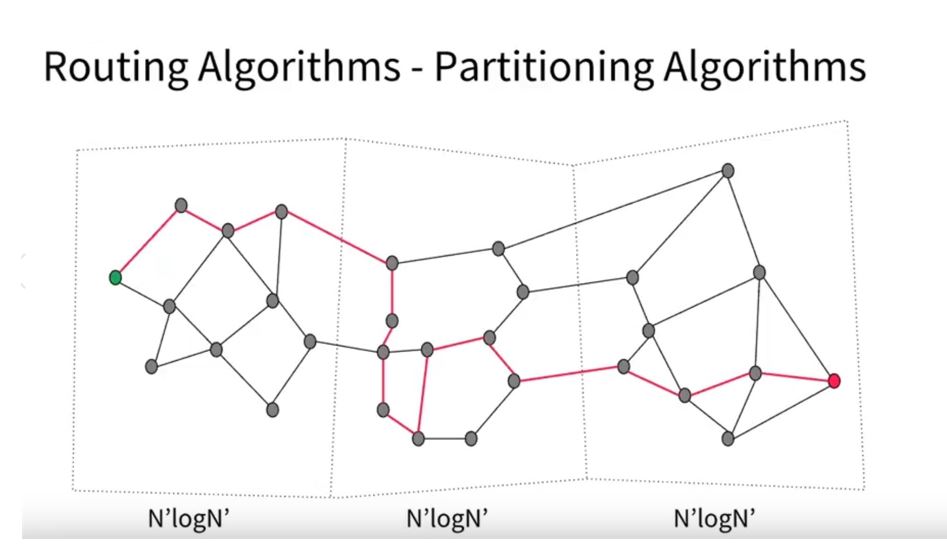
The shortest path distance requires an algorithm similar to Dijkstra’s shortest path search. However, typically between a starting and target destination, there will be many road segments. Dijkstra’s algorithm performance is O(N*log(N)), where N is the number of road segments. O(N*log(N)) will take an extremely long time to return the estimate if we process each road segment individually. However, we can improve the processing speed by dividing the road segments into chunks by region and pre-calculating time ETAs for regions based on a combination of real-time and historic driving time stats. We can then find the shortest path via traversing over the pre-processed (processed by a background job) road region segments (group of road intersections) rather than individual road segments. See this concept in the above diagram. Suppose we are working on N road segments – by grouping the respective road segments into regions, we can decrease processing from N to the square root of N. Decreasing the number of segments improves performance substantially as instead of working on millions of road segments, we will process only a few thousand regions.
Data storage design
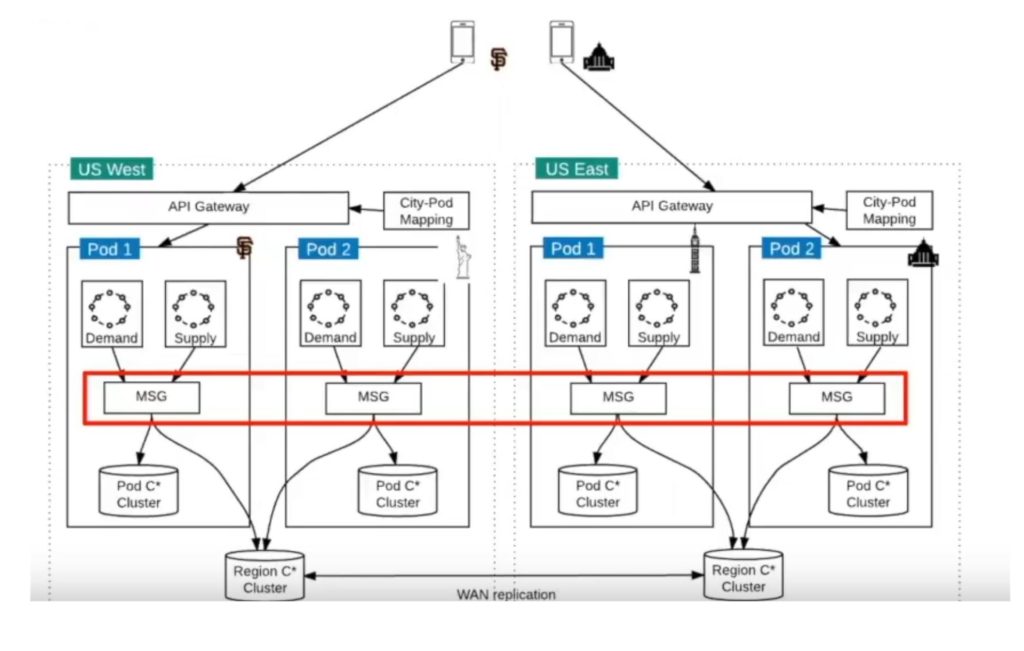
Above is the diagram based on how uber manages its storage. The data center has multiple pods (set of nodes processing workload – supply and demand). Each pod has its dedicated storage (in-memory (Redis) + persistent storage cluster (Cassandra)). In addition, each data center has a data center-wide cluster. Each request is written twice into pods data storage and data center-wide storage. Data within the data center is written synchronously to the two data stores. Data is replicated async across data centers to provide additional cross-data center redundancy.
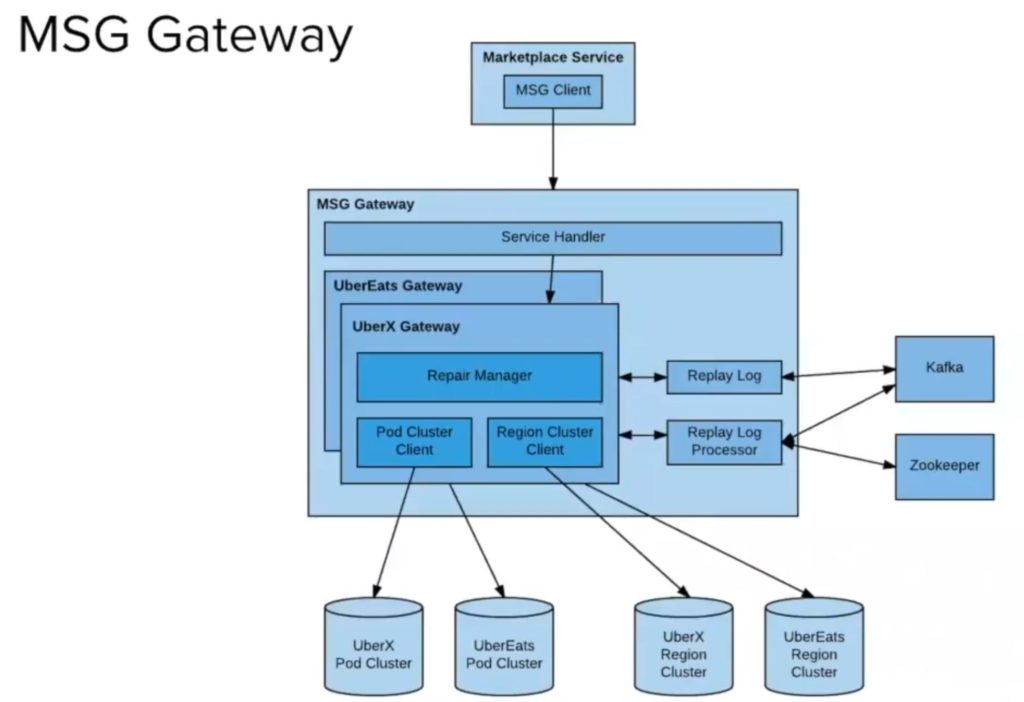
Given that data is being written into two different data stores, writing to one may succeed while that to the other fails. Thus, when reading the data, Uber also reads it from the two data stores, but when processing the data, it uses the latest data among the two data stores. It can determine the latest data by utilizing a monotonically increasing version number. While persisting the writes, if write to one data store succeeds while the other fails, Uber does the following :
- The failed writes are written by the repair manager to a replay log
- Replay log transmits the failed writes to Kafka
- Writes from Kafka are pulled by a replay processor
- Replay processor persists the failed writes to the storage
See details in the image below
For the driver location index, we can utilize a composite key based on driver id and time. Based on the driver key, we will shard via a hash to a partition and then use the time as a clustering key to store the data within the given partition.
As mentioned previously, in addition to persisting the data into a persistent data cluster, the data is also written into a distributed in-memory DB (Redis) for fast read access. This is needed so that we can efficiently lookup available drivers in a certain location without increasing pressure on the physical db.
Sharding & Dynamically handling high load in regions
As previously mentioned, we shard the processing per product first and then by geographic indexing into a consistent hash ring. Thus, when traffic increases in a region, we can increase the shard division in a hash ring region by adding more nodes. In addition, we can increase the data replication in that hash ring region and add more workers to the shard region that’s under heavy load.

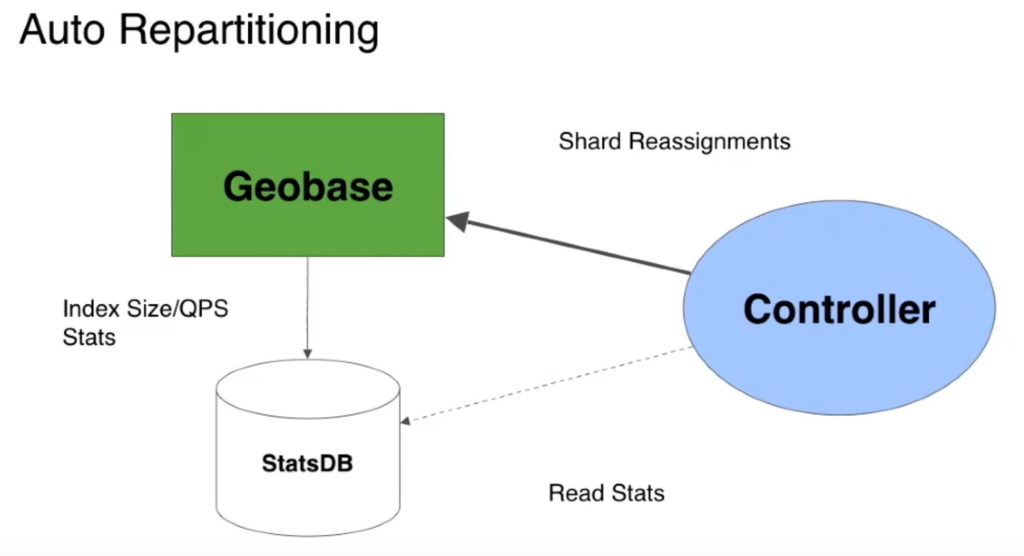
The load on the system can be monitored by an external service that can dynamically restructure the geo-base shards division, increase or decrease replication, and add or remove workers to a region based on load. For example, see the below image describing this concept via the controlled service.
As an interesting note, Uber went through several sharding schemes as its business expanded. They started with city-based sharding, then move to geo sharding, and then a combination of product and geo sharding.
Design choices for high availability
- Persist the writes across clusters in same data center synchronously
- Replicate data asynch across data centers
- Manage spikes in load via dynamically configuring shards and replication based on current and anticipated system load
- Rather than designing for graceful shutdowns, Uber as a design policy deliberately designs systems to handle crashes elegantly
- Structure calls to be retryable
Interesting items but not covered in this design
- The system should dynamically price regions based on demand and supply
- Drivers should be incentivized and motivated to drive to areas of high demand
- Both users and drivers should be able to see their trips history
- Leverage ML to improve the above features that the system provides
- Financial charging, reporting, and many other topics are not covered in this design
References
Excellent presentation from 2015 covering the Uber System Design then by the head of architecture at Uber
https://www.infoq.com/presentations/uber-market-platform/
http://highscalability.com/blog/2015/9/14/how-uber-scales-their-real-time-market-platform.html
An article on Uber tech stack in 2016 (it’s divided into two parts).
https://eng.uber.com/tech-stack-part-one-foundation
An article from Uber describing why use gateways to microservices
https://eng.uber.com/architecture-api-gateway/
An article describing Uber’s Hexagonal Hierarchical Spatial Index Library
Uber’s financial computation platform
https://eng.uber.com/ubers-finance-computation-platform/
A presentation on location-services, storage, and other interesting concepts by an Engineer at Uber Marketplace
A presentation on how uber utilizes distributed locks for its services
A presentation on uber’s H3 library and how it’s utilized to split earth regions into a list of tiles
A talk on Uber’s data storage
An article describing Uber’s stack history
https://stackshare.io/stack-history-timeline-uber-tech-stack-evolution
Domain oriented micro-architecture at Uber
https://eng.uber.com/microservice-architecture/
Google S2 library
Very nice article on the reasons why Uber switcher to MySql from Postgres
https://eng.uber.com/postgres-to-mysql-migration/
A presentation on Google S2 library
Uber’s engineering blog has some very interesting write-ups. Please have a look at Uber’s engineering blog.